TLDR
- JPG is much faster to write than PNG.
- JPG at q=100 results in file sizes approximately the same as PNG when compression=9.
- Leave JPG optimization off as it has very little impact but costs time.
- Use a quality setting of q=70 when saving JPG files.
- Example C++ code: cv::imwrite("image.jpg", mat, {cv::ImwriteFlags::IMWRITE_JPEG_QUALITY, 70});
Summary
I use OpenCV when working with images and videos. I use it quite a lot. I was in a position recently to examine the exact cost of calling cv::imwrite() in some code to measure the exact "cost" of calling it repeatedly.
Using imwrite()
When debugging -- especially when working with code that consumes and produces video files -- it is sometimes useful to call cv::imwrite() to save individual frames to disk for inspection. While I knew this slowed down my application, I had never before attempted to quantify exactly how slow it is to write 30 FPS to disk as individual PNG or JPG images.
This is an example of how to use OpenCV to write PNG images:
This is the same example but using JPG instead:
Questions I wanted answered:
- What is the overall cost of calling cv::imwrite()?
- What is the cost of using the different levels of PNG compression?
- What is the cost of using the different levels of JPEG quality?
The code I used to test cv::imwrite() is from the MoveDetect project. And the test video is also from that project. The video is 640x480 @ 29.97 FPS, and exactly 90 frames in length, or 3.003 seconds.
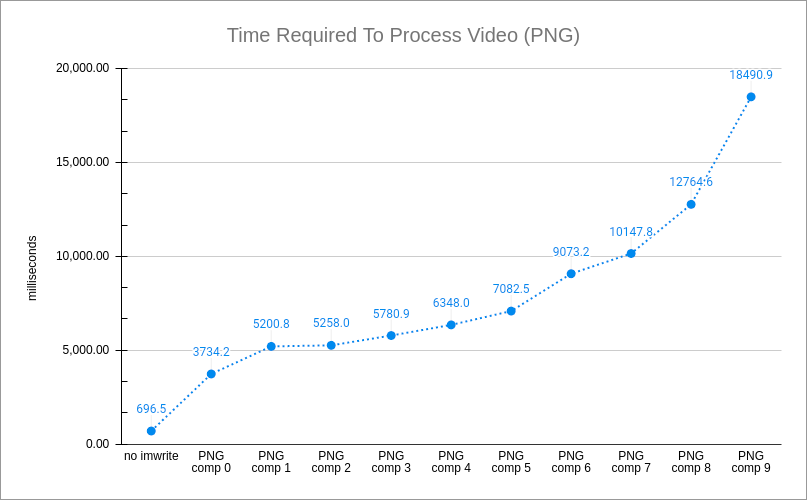
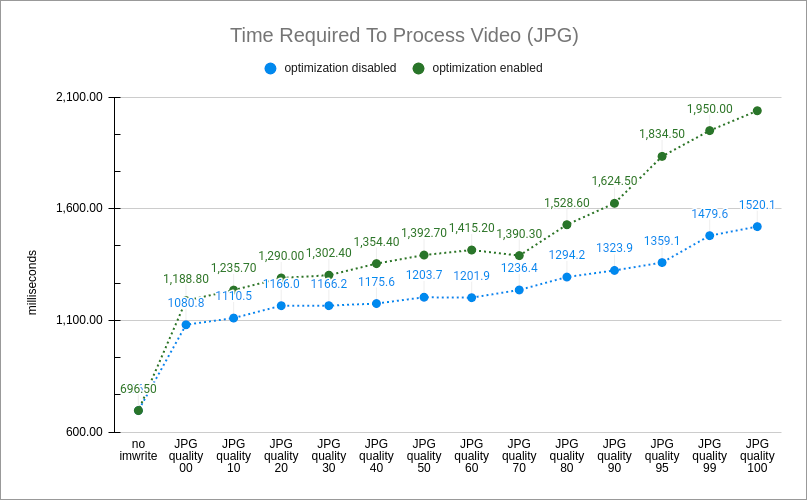
Processing the 90 frames without calling cv::imwrite() takes on average 696.5 milliseconds. I'll include that number in the charts below.
Saving PNG Images
PNG images have 1 obvious tunable setting: the amount of compression to perform. The scale is a single digit from zero to nine, where at zero the PNG code performs no compression, and nine is the maximum. Example C++ code:Remember that unlike JPEG images, the PNG format is non-lossy, so the compression level does not alter the image itself. The only change is to the size of the file at the expense of CPU time during the compression stage.
The following chart shows the length of time it took my test application to run depending on the PNG compression level:
Unsurprisingly, the higher you set the compression level, the longer it took to run. But this chart only makes sense when you also compare the output of turning up the compression. The following chart shows the size of the output image as you increase the compression level:
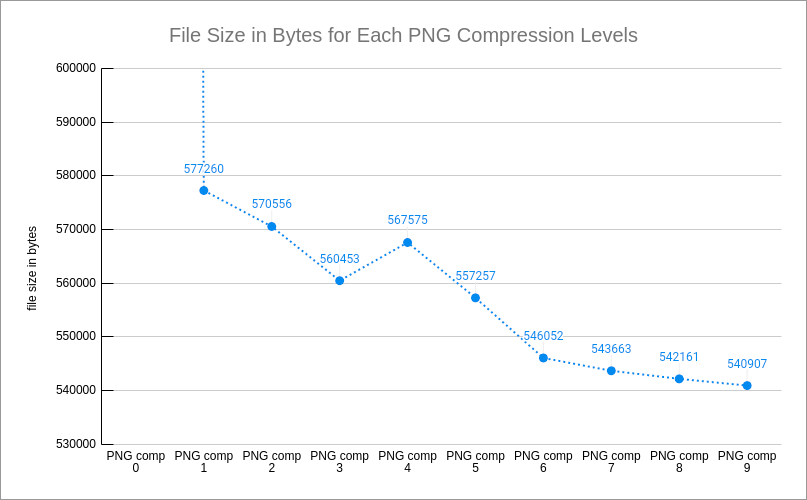
At compression level zero, the file was 2.7 MiB in size, which is large enough to make the rest of the chart look like a flat line, so I excluded it from the chart. The slight bump up at compression level 4 is a quirk of this particular image at this compression level.
In terms of time, the test increases from ~3.7 seconds to ~18.5 seconds. Meanwhile, the file sizes went from 563.7 KiB to 528.2 KiB, which is a very small difference in size considering the time increased 500%.
Also note the original test time when not writing any images was ~0.7 seconds, so even at compression level zero the overhead of calling cv::imwrite() in a video processing loop is significant.
Saving JPG Images
JPG images have 1 obvious tunable setting, and 1 additional toggle switch I'll discuss. The tunable setting is the "image quality", a number from zero to 100. While the toggle switch is called "optimization". Some example C++ code:
The images test_1.jpg and test_2.jpg should be exactly the same in the example code above since the default value for optimization is zero.
When quality is set very high (> 95) then enabling optimization results in slightly smaller files. But in my opinion, even then the cost in time doesn't make it worthwhile. This chart shows the length in time it took the test to complete, when optimization is turned off and turned on:
This chart shows the resulting file sizes for many of the quality settings:
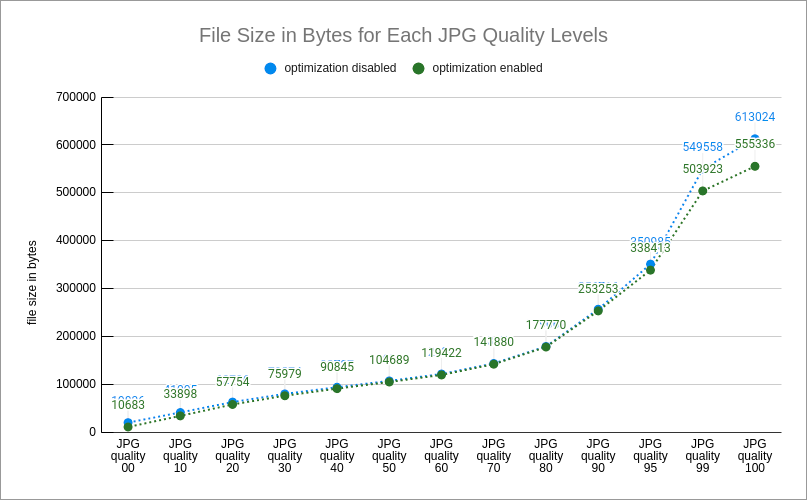
Note that on the X-axis, the last 3 entries are just a few values away from each other while the rest of the entries all have a difference of 10 between each other.
Turning on JPG optimization results in longer write times, but has no discernable impact on the file size until the quality increased beyond 95. And even then, at q=100, the length of time increases from 1.5 seconds to 2.0 seconds, but the file size only decreased from 598.7 MiB to 542.3 MiB.
It is important to point out the scale on the different charts (PNG vs JPG) is different. The test completed was exactly the same in all 3 scenarios (PNG, non-optimized JPG, optimized JPG). But when saving the frames as PNG files, the length of time ranged from 3.7 to 18.5 seconds. With JPG files, the length of time ranged from 1.2 seconds to 2.0 seconds. Similarly with the size of file, the PNG images were all ~ 1/2 MiB in size, while the JPG files ranged from ~600 KiB down to 10.4 KiB.
Of course, the JPG files at both extremes of the quality range are problematic. When q=100 there are certain JPG features which are disabled, and if you need such a high-quality image to compare indiviual pixels you are likely to use PNG anyway. And anything below q=20 is painful to look at.
The JPEG optimization flag (cv::ImwriteFlags::IMWRITE_JPEG_OPTIMIZE) does not modify the image, it only alters the size of the file. See the table at the very bottom of this post which shows frame #60 from the test video at different quality levels and optimization settings. To better compare those frames, here are several key portions cropped and pasted together:
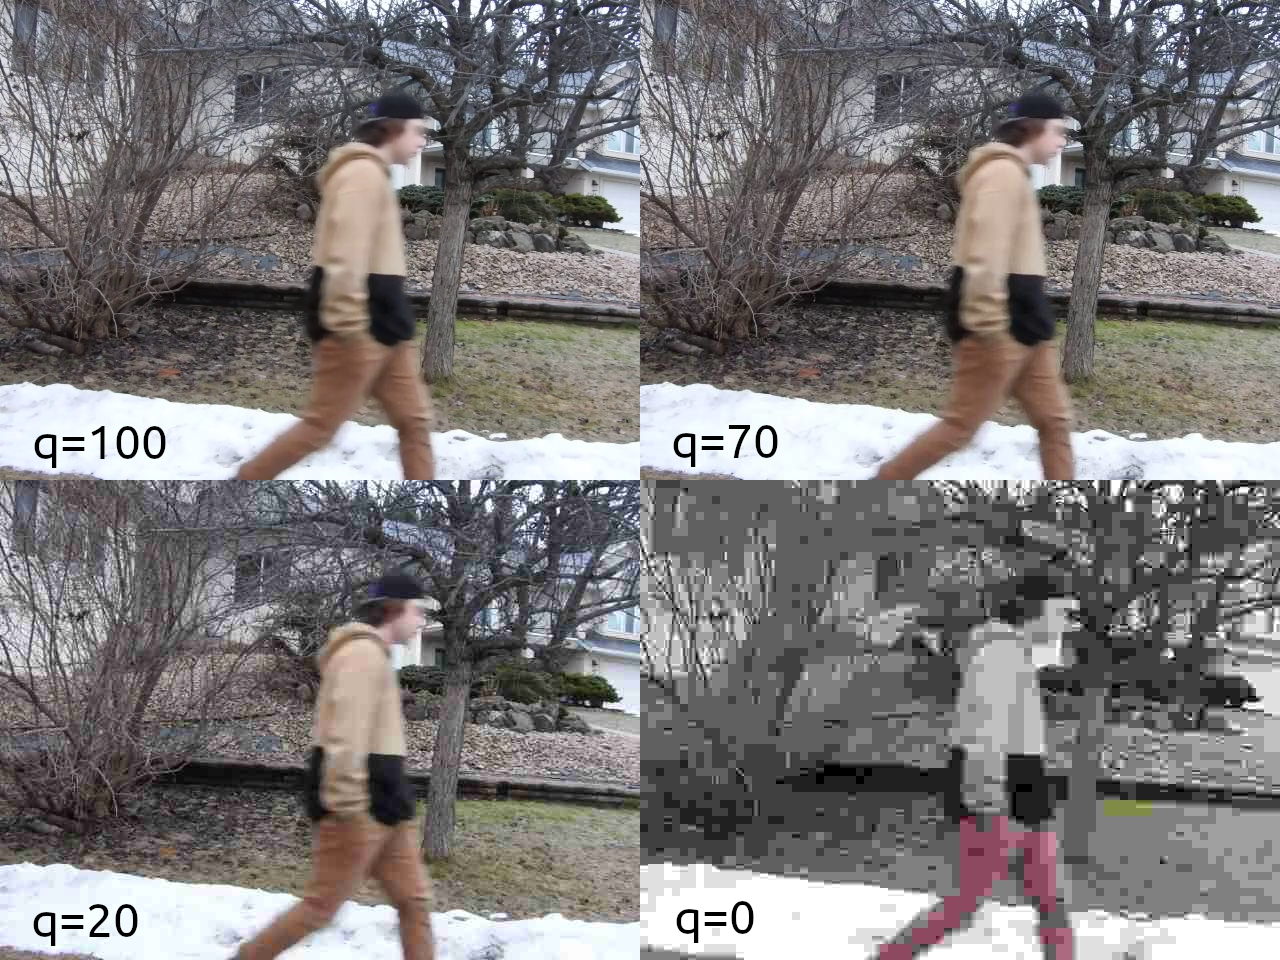
Without digging deep into the topic of JPEG image quantization, there is little visual difference between q=70 and q=100, and even as low as q=20 the image artifacts in the uniform-colour sleeves and snow are minimal. As someone who blindly defaults to q=70 when saving JPG files, I was both happy to see these results while also surprised that the quality can be lowered much more without making significant more impact to the image. The time chart also shows that choosing a quality value somewhere between 50 and 70 seems to be a good choice, given that the time cost increases linearly somewhere between q=70 and q=80 until q=100.
| Description | Optimization=0 | Optimization=1 |
|---|---|---|
| q=100 |  |
 |
| q=99 |  |
 |
| q=95 |  |
 |
| q=90 |  |
 |
| q=80 |  |
 |
| q=70 |  |
 |
| q=60 |  |
 |
| q=50 |  |
 |
| q=40 |  |
 |
| q=30 |  |
 |
| q=20 |  |
 |
| q=10 |  |
 |
| q=0 |  |
 |
